
At some point, every SQL developer or DBA will need to debug T-SQL scripts, either to verify that they behave as expected or to track down the root cause of a problem. Whether you’re building something new or investigating a production issue, debugging is an essential part of the process.
There are several techniques available for troubleshooting, and it’s important to approach this differently depending on whether you’re working in a production or non-production environment. Each environment has its own risks and constraints.
Let’s walk through some of the most useful techniques for debugging T-SQL effectively.
The Humble Print Statement
One of the simplest ways to start debugging T-SQL is by using PRINT statements. They allow us to trace the flow of execution, identify which parts of the script are running, and inspect the values of parameters and variables at different points.
A quick tip: PRINT outputs to the Messages tab in SSMS, whereas SELECT outputs to the Results tab.


PRINT is especially useful for confirming that conditional branches (like IF statements) are behaving as expected, or for tracking progress through long or complex procedures.
One downside of using PRINT is that you won’t see any output until the script has finished executing. This can be frustrating when you’re trying to monitor long-running code or catch something happening mid-way through execution.
Luckily, there’s a sneaky (and very effective) workaround.
Get Instant Feedback with RAISERROR
Normally, RAISERROR is used to raise actual errors, hence the name. But when debugging, we can take advantage of it by raising messages with low severity and state, so they show up in the Messages tab without interrupting execution.
By specifying a severity level of 0 to 10, the message behaves more like a debug printout than a real error. It won’t trigger error handling or rollbacks, but it will display immediately when used with the NOWAIT keyword.
This is much better than using PRINT because we get instant feedback messages. Very handy for long-running scripts!

If you’re interested in how long each part of your script is taking, you can enhance your debug messages with timestamps. This helps you understand performance bottlenecks and monitor the time taken between key steps.

If you’re going to use this method a lot, then you could even create yourself a stored procedure to avoid some typing and eliminate duplicate code. I won’t go into detail about the pros and cons of doing this though. That’s for another post.
					CREATE PROCEDURE dbo.PrintDebugMessage (@Message NVARCHAR(1000))
AS
BEGIN
	DECLARE @DebugMessage NVARCHAR(2000);
	SET @DebugMessage = CONVERT(NVARCHAR, GETDATE(), 121) + N' - ' + @Message;
	RAISERROR (@DebugMessage, 0, 1) WITH NOWAIT;
END
GO

Stepping it up with table variables
We can use a table variable to keep a list of debug messages and parameter/variable values. The beauty of this is that variables are not affected by rollbacks and we can query the table variable any way we like. As long as the query window connection stays open, the table variable will keep it’s content.
					DECLARE @Debug TABLE
(
	Created DATETIME2,
	Message NVARCHAR(4000)
)

BEGIN

DECLARE @i INT = 2

IF @i = 1
BEGIN
	INSERT INTO @Debug VALUES(SYSDATETIME(), 'Scenario 1')
	/* Do some things */
END
ELSE
BEGIN
	INSERT INTO @Debug VALUES(SYSDATETIME(), 'Scenario 2')

	BEGIN TRY
		DECLARE @MyNumber DECIMAL(10, 2) = 5

		SET @MyNumber = @MyNumber -4

		INSERT INTO @Debug VALUES(SYSDATETIME(), 'The subtraction part worked. @MyNumber = ' + CAST(@MyNumber AS VARCHAR))

		SET @MyNumber = @MyNumber / 0

		INSERT INTO @Debug VALUES(SYSDATETIME(), 'The division part worked')
	END TRY

	BEGIN CATCH
		INSERT INTO @Debug VALUES(SYSDATETIME(), ERROR_MESSAGE())
	END CATCH
END

SELECT * FROM @Debug
SELECT Message AS ThisNeedsFixing FROM @Debug WHERE Message LIKE '%error%'

END
The script above errored somewhere in ELSE part of the IF statement. We can select from our table variable to see the logical flow and the value of a variable right before the error occurred.
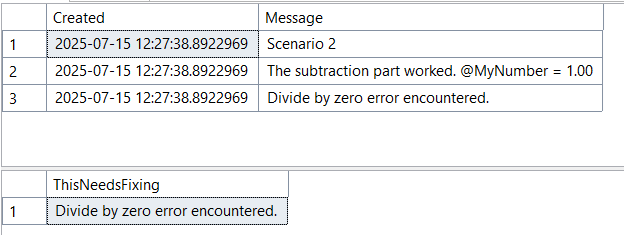
This is a very simplified example but it highlights what’s possible and hopefully you can see how this would be useful in more complicated scripts.
Environment Considerations
When you’re debugging scripts in a development environment, there’s less pressure to ensure you don’t break something. However, there are times when we need to do this in production, especially when we can’t recreate the problem anywhere else.
If you’re working with a function or stored procedure, directly editing the live code isn’t ideal. Instead, you can create a temporary version to safely experiment.
For stored procedures, you can use the same # or ## syntax as temporary tables to create temporary procedures that live as long as your session is active. Personally, I prefer to create a copy of the procedure with a prefix (e.g., my initials). This approach avoids losing any changes and is easy to clean up later.
Unfortunately, functions don’t support the # or ## temporary naming convention. In this case, you’ll need to manually create a copy under a different name using the same prefixing approach.
If your organisation doesn’t allow creating new objects in production, even temporary ones, your best bet is to copy the code out of the procedure or function and paste it into a new query window. Then run it as a standalone script so you can debug safely, without making changes to live database objects.
One last thought
For those of you who know about the SSMS debugger, you may be wondering why I haven’t mentioned it. Despite this functionality being popular, it was removed in SSMS v18 and you can read about why it won’t be coming back in this post by Erin Stellato.
Even when I was a developer I didn’t use the SSMS debugger as you can get into a real mess with it, especially if you’re debugging a production database (don’t do this!).
That said, I understand there are legitimate use cases for stepping through T-SQL. If you do need this functionality then read Erin’s post about using Visual Studio instead.
Pingback: Ways to Debug T-SQL Scripts – Curated SQL