
When working with SQL Server, there are times when we need to insert a large number of rows into a table. This might be to populate test data in a non-production environment or to pre-load a new table with data from another system. There are several methods to achieve this, but in this article, we’ll focus on the impact of using multiple INSERT statements.
Setting up our test environment
To illustrate this, we’ll set up a test database using the script below. Before we begin, it’s important to ensure that the transaction log has sufficient space to handle the workload, avoiding the need for auto-growth during the test.
					USE master
GO

CREATE DATABASE InsertTest
ON PRIMARY (NAME = N'InsertTest', FILENAME = N'C:\Program Files\Microsoft SQL Server\MSSQL15.SQL2019\MSSQL\DATA\InsertTest.mdf', SIZE = 50MB)
LOG ON (NAME = N'InsertTest_log', FILENAME = N'C:\Program Files\Microsoft SQL Server\MSSQL15.SQL2019\MSSQL\DATA\InsertTest_log.ldf', SIZE = 50MB)
GO

USE InsertTest
GO

CREATE TABLE dbo.Customer
(
	ID INT IDENTITY(1, 1) NOT NULL,
	Title VARCHAR(10) NOT NULL,
	FirstName NVARCHAR(50) NOT NULL,
	LastName NVARCHAR(50) NOT NULL,
	DoB DATE NOT NULL,
	Address NVARCHAR(60) NOT NULL,
	City NVARCHAR(15) NOT NULL,
	Region NVARCHAR(15) NOT NULL,
	PostCode NVARCHAR(10) NOT NULL,
	Country NVARCHAR(15) NOT NULL,
	Phone NVARCHAR(24) NOT NULL,
	CreateDate DATETIME NOT NULL,
	CONSTRAINT PK_Customer PRIMARY KEY CLUSTERED (ID)
);
GO
Inserting the rows
Now that our table is set up, we can begin inserting rows using a loop. While the customer data we’re adding is arbitrary and not meaningful, it serves our purpose of demonstrating bulk inserts.
The query below will insert 50,000 rows and then display the time taken in milliseconds. To simplify the process, I’ve used the REPLICATE function, which helps us visualise the length of each text value being inserted.
Since our table has no indexes or foreign keys, we don’t need to worry about the potential slowdown that these constraints might cause during the insert operations.
					DECLARE @i INT = 1, @StartTime DATETIME2, @FinishTime DATETIME2;

SET @StartTime = SYSDATETIME();

WHILE @i < 50001
BEGIN
	INSERT INTO dbo.Customer (Title, FirstName, LastName, DoB, Address, City, Region, PostCode, Country, Phone, CreateDate)
	VALUES (REPLICATE('a', 10), REPLICATE('b', 10), REPLICATE('c', 10), '20100101', REPLICATE('d', 50), REPLICATE('e', 15), REPLICATE('f', 15), REPLICATE('g', 10), REPLICATE('h', 15), REPLICATE('i', 15), GETDATE());

	SET @i = @i + 1;
END

SET @FinishTime = SYSDATETIME();

SELECT DATEDIFF(MILLISECOND, @StartTime, @FinishTime) AS TimeMS;
All 50,000 rows were inserted in just over 6,600 milliseconds, or 6.6 seconds.

Enhancing Performance
While a duration of 6.6 seconds might be acceptable in some cases, there are often scenarios where faster insert operations are crucial. In many environments, keeping execution times within strict service level agreements (SLAs) requires us to minimise even millisecond-level delays.
To speed things up, we’ll use the same code as before, but this time, we’ll wrap the inserts within a transaction.
					DECLARE @i INT = 1, @StartTime DATETIME2, @FinishTime DATETIME2;

SET @StartTime = SYSDATETIME();

-- ** Start our new transaction here **
BEGIN TRAN

WHILE @i < 50001
BEGIN
	INSERT INTO dbo.Customer (Title, FirstName, LastName, DoB, Address, City, Region, PostCode, Country, Phone, CreateDate)
	VALUES (REPLICATE('a', 10), REPLICATE('b', 10), REPLICATE('c', 10), '20100101', REPLICATE('d', 50), REPLICATE('e', 15), REPLICATE('f', 15), REPLICATE('g', 10), REPLICATE('h', 15), REPLICATE('i', 15), GETDATE());

	SET @i = @i + 1;
END

-- ** Now commit our new transaction **
COMMIT TRAN

SET @FinishTime = SYSDATETIME();

SELECT DATEDIFF(MILLISECOND, @StartTime, @FinishTime) AS TimeMS;
This time, the operation completed in just over 3,000 milliseconds—roughly half the time of the previous duration.

The reduction in duration is due to the difference in how the transaction log is utilised in implicit versus explicit transactions. Let’s take a closer look at what’s happening.
Implicit transactions
When you run a query without explicitly defining a transaction, SQL Server automatically creates an implicit transaction behind the scenes. This is necessary to ensure that all data modifications are properly recorded in the transaction log, enabling SQL Server to roll back changes in case of an error or system crash.
We can observe this by examining the transaction log using the sys.fn_dblog function. Although this function returns a vast amount of data, I’ve limited the output to a few key columns to make it easier to understand what’s happening in our demo.
					SELECT [Current LSN],
	Operation,
	[Transaction ID],
	AllocUnitName
FROM sys.fn_dblog (NULL, NULL);

The output can be a bit difficult to interpret, so let’s break it down. I’ve filtered the results to display only the log entries related to our inserts.
- Current LSN (Log Sequence Number): This number is crucial for SQL Server to track the order of operations correctly.
- Operation
- LOP_BEGIN_XACT: Indicates the start of a transaction.
- LOP_INSERT_ROWS: Indicates that rows were inserted.
- LOP_COMMIT_XACT: Indicates that a transaction was committed.
- Transaction ID is essential because it allows us to link specific log entries to their corresponding transactions. Here, we can observe a repeating pattern of three rows per transaction.
- AllocUnitName lets us confirm that the rows were inserted into our Customer table.
Explicit transactions
An explicit transaction is one that we define manually, rather than letting SQL Server handle it automatically behind the scenes. When we examine the transaction log in this scenario, we notice a single Transaction ID, along with one LOP_BEGIN_XACT and one LOP_COMMIT_XACT. All the insert operations are still recorded, but they’re grouped within a single transaction rather than spread across multiple transactions.
Since all the inserts are contained within one transaction, we can use the Transaction ID to filter the results from the sys.fn_dblog query. This helps minimize noise from other processes, allowing us to focus on our specific transaction. Given that we’re inserting 50,000 rows, it’s relatively easy to identify the correct Transaction ID in the log.
					SELECT [Current LSN],
	Operation,
	[Transaction ID],
	AllocUnitName,
	[Lock Information]
FROM sys.fn_dblog (NULL, NULL)
WHERE [Transaction ID] = '0000:00041dcf';
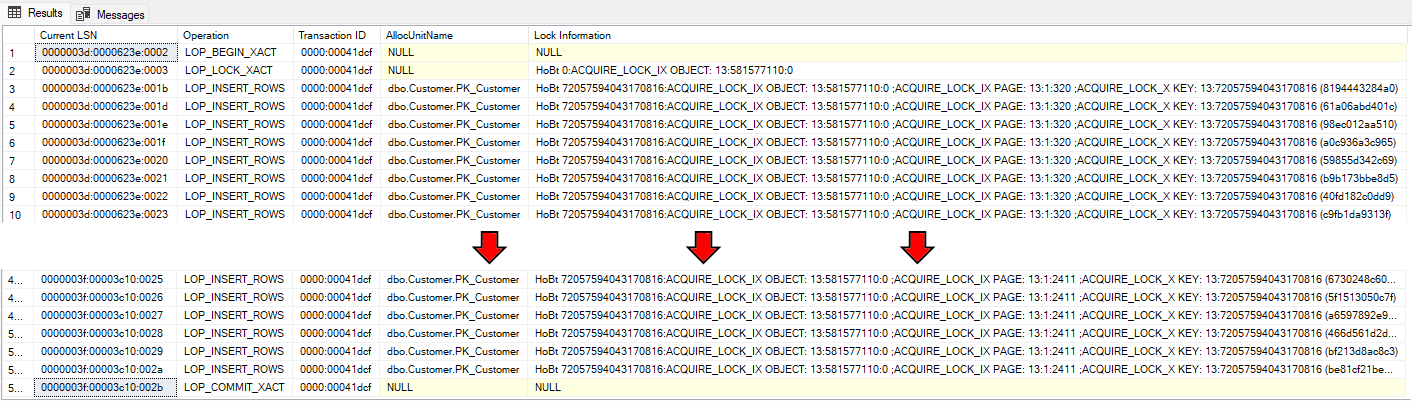
In these results, we can see the transaction starting at the top, followed by multiple row inserts, and finally, the transaction commit at the bottom. I’ve omitted most of the row insert entries because no one wants to scroll through an image with over 50,000 rows!
The improved duration in our second query is due to SQL Server performing less work in the transaction log.
Transaction log considerations
When inserting multiple rows within a single transaction, the transaction log must retain the necessary space until the transaction is either committed or rolled back. If the log isn’t large enough, it will need to auto-grow. If auto-grow is disabled or there isn’t enough disk space available, the log could run out of space, causing the query to fail.
To mitigate this, one approach is to break down the inserts into smaller chunks. For instance, you could still use explicit transactions but insert only 10,000 rows per transaction. This approach allows the transaction log to free up space after each commit.
What about that Lock Information column?
Keen observers may have noticed an additional column in the second query’s output: Lock Information. I included this to highlight the LOP_LOCK_XACT table-level lock. When inserting 50000 rows in a single transaction, SQL Server efficiently locks the entire Customer table. While this isn’t usually an issue in non-production environments, it can lead to unwanted blocking in production databases, so proceed with caution.
Let’s break down the Lock Information value: “HoBt 0:ACQUIRE_LOCK_IX OBJECT: 13:581577110:0”.
HoBt stands for Heap or B-Tree. A Heap is a table without a Clustered Index, while a B-Tree refers to a Clustered Index.
13 is the ID of our database.
581577110 is the ID of our Customer table.
We can confirm this by running the following query.
SELECT DB_NAME(13) AS DatabaseId, OBJECT_NAME(581577110) AS ObjectName

Key Takeaways
Using explicit transactions can significantly speed up bulk inserts because SQL Server performs less work in the transaction log. This approach is especially beneficial when populating databases with large amounts of test data across multiple tables. While saving a few seconds on each operation might not seem like much, these small gains add up to a substantial performance boost. This can be particularly valuable when automatically spinning up test environments, reducing the wait time for setup completion.